Quick Answer
A chart of accounts is the master list of every category your business uses to track money — every type of income, expense, asset, liability, and equity. It’s the backbone of your books. Every transaction gets coded to one of these accounts, and every report your accounting software produces is built by pulling from them. A well-designed chart of accounts makes your financial statements useful, your tax prep clean, and your business decisions data-driven. A messy or generic one creates books that technically work but don’t tell you anything — which is the situation most struggling businesses find themselves in without realizing it.
What a Chart of Accounts Actually Is
If you’ve ever looked at a P&L that had a giant line called “General Expenses” or “Miscellaneous” and thought “that doesn’t tell me anything” — you were looking at a chart of accounts problem.
Think of it as the filing cabinet for your business’s money. Every dollar that comes in or goes out gets filed into a specific drawer — labeled “Rental Income,” “Materials,” “Payroll,” “Software Subscriptions,” and so on. When it’s time to run a report, your accounting software opens each drawer, counts what’s in it, and hands you a total.
If your drawers are labeled well, the report is useful. If they’re labeled “Stuff” and “More Stuff,” the report tells you nothing — even if the totals add up correctly.
★ ★ ★ ★ ★
“Jenny and her team have helped me reshape my financial life entirely. They took the 8-year mess of a disorganized, self-employed musician and completely transformed it with order, organization, and detail. The weight and immensity of that stress is now completely lifted and I owe it all to them. Thanks again for transforming my life, Jenny.”
— Joshua, self-employed musician · Google Review
Joshua’s story is exactly why chart of accounts design matters. Eight years of transactions without a coherent structure isn’t a bookkeeping problem — it’s a chart of accounts problem. Everything gets recorded, but nothing tells him what’s working. Rebuilding the chart of accounts is usually the first thing we do in a cleanup like his, because everything else depends on it.
The 5 Core Account Types
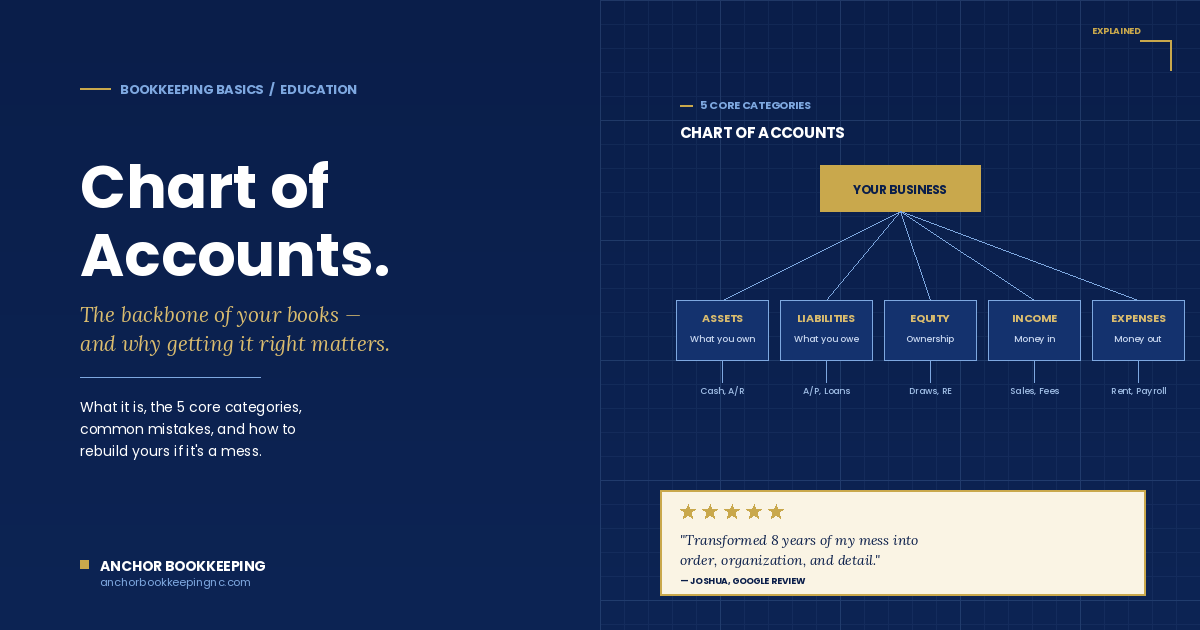
Every chart of accounts is organized around five fundamental categories. These aren’t optional — they’re required by every accounting standard and every accounting software. The customization happens in the sub-categories underneath each one.
1. Assets
What your business owns. Cash, accounts receivable (money customers owe you), inventory, equipment, vehicles, real estate. Sub-categorized into current assets (usable within a year) and long-term assets (equipment, buildings).
2. Liabilities
What your business owes. Accounts payable (money you owe vendors), credit card balances, loans, sales tax collected but not yet remitted, payroll taxes withheld. Sub-categorized into current liabilities (due within a year) and long-term liabilities (mortgages, multi-year loans).
3. Equity
Ownership. Owner contributions (money the owner puts in), distributions/draws (money the owner takes out), retained earnings (accumulated profit that stayed in the business). This is where most DIY bookkeeping is weakest — draws routinely get misclassified as expenses, which distorts everything downstream.
4. Income
Money coming in from the business’s core activity. Rental income, service revenue, product sales, commissions. Broken out by revenue stream so you can see what’s actually driving the business. A landscaping business shouldn’t have one line called “Income” — it should have “Maintenance,” “Installation,” “Snow Removal,” and “Consulting” so the owner can see which offerings are growing.
5. Expenses
Money going out for operating the business. Labor, rent, insurance, materials, marketing, software, utilities, professional fees. This is where a chart of accounts either gives you insight (“I spent 22% more on subcontractors this quarter”) or gives you nothing (“General expenses were $47K”).
What a Good Chart of Accounts Looks Like
There’s no single “correct” chart of accounts — good design depends on the industry, business model, and what the owner needs to see. But the best ones share five characteristics:
- Structured for the industry. Construction companies need cost codes and job categories. Real estate investors need per-property tracking. Law firms need trust account structure. E-commerce businesses need channel-level revenue breakdown. Generic templates don’t do any of these well.
- Aligned with tax categories. Categories should match what shows up on the business’s tax return (Schedule C, 1120-S, 1065, Schedule E) so your CPA isn’t recategorizing everything at tax time.
- Detailed enough to be useful, simple enough to maintain. Too few categories (“Expenses: $180K”) tells you nothing. Too many categories (“Coffee Purchases — Downtown Office — Monday Meetings”) creates data entry chaos. Aim for 40–80 accounts for most small businesses.
- Consistent categorization rules. Same vendor, same category, every time. Same expense type, same account, every time. Consistency is what makes historical comparisons meaningful.
- Clean separation of operating vs. non-operating. Sale of an asset, interest earned on savings, and one-time insurance payouts shouldn’t be mixed in with core revenue. Otherwise your P&L can look artificially great in months you sold something.
Common Chart of Accounts Mistakes We Fix
When we take on a new bookkeeping client at Anchor, the first thing we look at is the chart of accounts — and the same handful of problems come up over and over:
- Using QuickBooks’ default chart out of the box — designed for a hypothetical generic business that doesn’t exist, useful for none.
- Owner draws coded as expenses — inflates expenses, understates profit, and creates an incorrect equity picture. One of the most common and most expensive mistakes.
- Everything lumped into “Miscellaneous” or “General” — usually 10–30% of a struggling business’s total expenses end up here. All of it is invisible to decision-making.
- Sub-accounts three levels deep with one transaction each — a chart of accounts with 400 accounts is usually worse than one with 50, because nobody categorizes consistently.
- No separation between cost of goods sold and operating expenses — makes it impossible to calculate gross profit, which is one of the three numbers that matter most.
- Payroll thrown into a single account instead of split (wages, payroll taxes, benefits) — obscures your true cost of labor.
- Sales tax and payroll tax mixed into revenue or expense accounts — these are liabilities, not income or expense. Miscategorizing them creates false profitability and inaccurate tax filings.
- Capital improvements coded as expenses — especially common for real estate investors and contractors. Triggers IRS issues and misses long-term depreciation.
Any single one of these can distort your reports enough that you’re making decisions on bad data. Fixing them is why cleanup engagements exist — and why the chart of accounts is always the first step.
Why This Matters More Than It Sounds
A well-designed chart of accounts affects almost every aspect of running the business:
- Financial statements become readable. Your P&L actually tells you what happened.
- Tax prep gets faster and cheaper. Your CPA can pull directly from categorized totals instead of recategorizing everything.
- You can spot problems earlier. A trend in a specific expense category shows up in month 2 instead of month 12.
- Pricing decisions get sharper. Knowing your true cost of delivering each service or product changes what you charge.
- Lender and investor conversations get easier. Anyone reviewing your financials can quickly understand what your business does and how it makes money.
- Historical comparisons become meaningful. Consistent categorization means “this month vs. last month” and “this year vs. last year” actually mean something.
What to Do If Yours Is Already a Mess
If you’re reading this and realizing your chart of accounts is exactly the problem in your books — you’re not alone, and you’re not stuck. The fix is straightforward, if not always quick:
- Audit what you have. Export your current chart of accounts. Look at every account. Ask: does this category tell me something useful, or is it a black hole?
- Design what you need. Based on your industry, business model, and what you actually need to see. Start with the 5 core categories and build out from there.
- Map old to new. Every existing account gets mapped to a new one — merged, renamed, split, or retired.
- Recategorize the current year (at minimum). So the current year’s reports actually reflect the new structure. Historical years can stay in the old structure or be cleaned up depending on your needs.
- Document the rules. Which vendor goes to which account. Which expense type goes where. Whoever does your bookkeeping (you, a team member, a bookkeeper) needs to be able to categorize consistently going forward.
For most small businesses, this is a 2–4 week project when done properly. For businesses with years of built-up mess — like Joshua’s — it’s usually done as part of a broader catch-up engagement.
Frequently Asked Questions
Can I change my chart of accounts after the business is running?
Yes, and most businesses need to at some point. Renaming accounts, adding new ones, or merging redundant ones is routine. Bigger restructures (splitting one revenue stream into three, or reorganizing the whole expense structure) require more care, especially if you want historical reports to remain comparable. Do these with a bookkeeper if you can.
How many accounts should I have?
For most small businesses, 40–80 accounts is a good target. Below 40, you’re probably missing granularity that would help you. Above 100, you’re probably creating maintenance headaches. Complex businesses (construction with job costing, multi-property real estate) will naturally have more.
What’s the difference between an account and a sub-account?
Accounts are top-level categories (Rent Expense). Sub-accounts add detail underneath (Rent Expense: Office, Rent Expense: Warehouse). Sub-accounts are useful when you need to see the total AND the breakdown. Use them sparingly — three levels of sub-accounts almost always creates more confusion than it solves.
Should I use the default chart of accounts from QuickBooks or Xero?
The default is a starting point, not a finish line. It’s built for a generic business that doesn’t match yours. Expect to spend 2–4 hours customizing it for your industry, and revisit it every 6–12 months as your business evolves.
Can two businesses have the same chart of accounts?
They shouldn’t, unless they’re in the exact same industry with the exact same business model. Even then, the strategic priorities of the owners often warrant different structures. A landscaping company that wants to grow the maintenance side vs. one that wants to grow installations should structure their income accounts differently to see the trend.
How does chart of accounts design affect taxes?
Enormously. Categories that align with tax return line items save time and money at tax prep and reduce the risk of miscategorization triggering IRS scrutiny. Categories that don’t align mean your CPA is essentially recategorizing everything from scratch each year — which costs more and introduces errors.
Do I need a bookkeeper to fix my chart of accounts?
For a very small business, no — the exercise of thinking through your accounts is often valuable in itself. For anything more complex, or if you’re rebuilding after a mess like Joshua’s, a bookkeeper is worth every penny. They’ve seen the patterns, know what works in your industry, and can rebuild it correctly the first time.
Books Feeling Disorganized?
If reading this made you realize your chart of accounts might be the reason your reports don’t make sense — that’s fixable. At Anchor Bookkeeping, we redesign chart of accounts as part of every new engagement, tailored to your industry and how you actually run your business. Whether you need a full cleanup like Joshua’s, or a smaller restructure so your P&L finally tells you something useful, we can help. Based in Charlotte, NC and serving small businesses nationwide, we’re QuickBooks Platinum ProAdvisors specializing in construction, real estate, trucking, legal, healthcare — and every kind of self-employed business owner who deserves clean books.
Disclaimer: This article is for informational purposes only and does not constitute tax, legal, or financial advice. Testimonials reflect individual experiences and do not guarantee similar results.
About the Author
Jenny Rodriguez is the Founder & CEO of Anchor Bookkeeping & Tax Solutions, based in Charlotte, NC. With over 10 years of experience supporting construction, trucking, legal, and real estate businesses, Jenny is a QuickBooks Platinum ProAdvisor and bilingual financial professional (English/Spanish). She founded Anchor in 2016 to give growing businesses the financial clarity and proactive support they deserve.
Browse Resources by Topic
Reach Out for Expert Guidance
Contact Anchor Bookkeeping and Tax Solutions today for tailored support in managing your financial needs. Our team is ready to provide personalized assistance to help you achieve your financial goals.